
November was a huge month for stocks. Aside from the Presidential election, it was more of the same low rates and money printing we have become accustomed to in the second half of this year. That description is likely to characterize the rest of 2020, and next year as well, since the Fed has assured us that they have no intention of raising rates anytime soon. However, investors should be aware: that is what the Fed sometimes says – before they change their minds. Corporate profits and GDP are rising quickly and it is only a matter of time before consumer spending begins to stoke inflation again, raising the risk that a change of course could be on deck sooner than expected.
Notwithstanding a seemingly out of control global pandemic, an unresolved presidential election, and some signs of a loss of momentum in the economy, equity prices in November soared to all-time highs yet again.
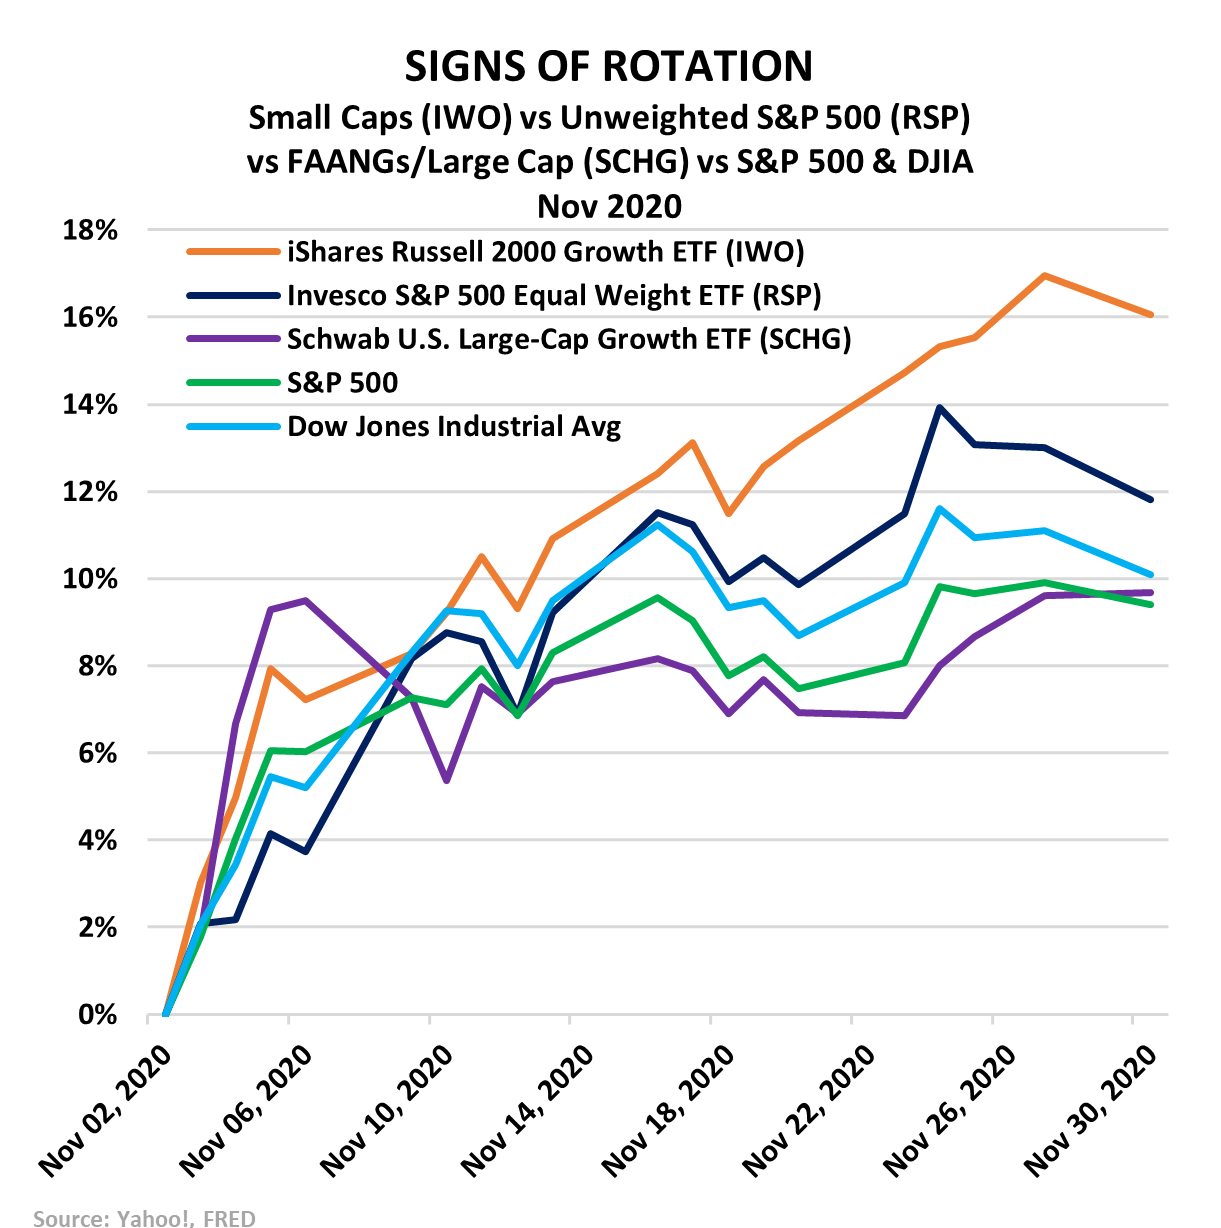
Over this past month, however, it wasn’t just the same old culprits like the FAANGS and other large-cap growth stocks that boosted the indices because of their heavy weight. Small caps came to life, jumping more than 16%, easily outperforming the Dow and S&P 500. In fact, the average stock (represented by an equal weighted fund of S&P 500 equities), was the second-best performing of this group.
Prior to Election Day, some pundits insisted that, if Trump came out on top, the market would go higher. Others argued a Joe Biden victory would mean the same thing. Just last month, however, MRP suggested that ultra-easy monetary policy is what’s really driving the surge. And it would be likely to persist well into next year, irrespective of the election outcome.
After the election, and an apparent Biden victory, bullish projections have not abated. Per ZeroHedge, Deutsche Bank is the only major player on Wall Street forecasting a lower year-end price target for the S&P 500 in 2021, projecting the index to close out next year at 3,450, down around -5% from current levels.
Over the past month, the net percentage of fund managers betting on a stronger economy and rising global profits in the next 12 months has reached its highest level since March 2002, according to Bank of America’s latest survey of 216 managers. The fund managers’ allocations to stocks hit a net 46% overweight, just shy of the 50% threshold BofA considers “extremely bullish”. Allocations of cash continued falling and now sits below pre-COVID levels at just above 4%.
These expectations can be largely chalked up to ultra-easy monetary policy, including an ongoing wave of quantitative easing (QE) with no end in sight. The Fed’s stimulus program has indeed been extraordinary.
Monthly Treasury purchases have continued at a pace of $80 billion since June. That is actually down from the April peak of more than $1 trillion.

This pace of money printing has literally flooded the U.S. economy with bank reserves. The M1 supply of money, which includes physical currency, demand deposits, travelers’ checks, other checkable deposits, and negotiable order of withdrawal (NOW) accounts had already been growing at a much faster clip than prior to the 2008 financial crisis. From 1976 to 2007, M1 grew at an average rate of just 5.2% YoY.
Between 2008 and 2019, however, growth in the M1 money stock averaged 9%, demonstrating the long-term impact a crisis and resulting monetary stimulus can have on the supply of cash in the economy.
This year, M1 growth rate has surged from mid-single digits in January to over 40% currently. Considering this recent increase in QE, investors should expect the growth of the money supply to remain elevated for some time…
To read the rest of this Viewpoint, START A FREE TRIAL You’ll also gain access to: If you already have a subscription, sign in


